
Plant Protection Today: PPQ Develops a Modeling Framework To Forecast Pest Risk

Effective June 4, 2025: This website, and all linked websites under the control of the agency, is under review and content may change.
A Web-Based System Customized to Support Animal and Plant Health Management Using Various Climate Data Sources
By April Dawson
Non-native pests and diseases will always pose a threat to U.S. agriculture. To help respond to pest and disease threats, USDA’s Plant Protection and Quarantine (PPQ) partnered with North Carolina State University (NCSU) to create a modeling system in 2014, Spatial Analytic Framework for Advanced Risk Information Systems (SAFARIS). SAFARIS is a web-based framework that incorporates historical and current weather and climate change data, pest biology, and other factors to create predictive models for plant pests. Last month, PPQ's Plant Pest Risk Analysis (PPRA) in collaboration with NCSU published a paper in Frontiers in Insect Science describing SAFARIS.
How SAFARIS Is Used
“SAFARIS was built to support organizations responsible for animal and plant health management, although the system can be adapted by any organization that wishes to use models driven by climatic, weather, and biological factors,” said Dr. Yu Takeuchi, an NCSU cooperator for PPRA and Principal Research Scholar/Associate Director for Innovation at NCSU’s Center for Integrated Pest Management. “In the paper, we describe how we built SAFARIS and demonstrate how it is used to create climate suitability maps and pest forecasts to support PPQ programs.”
SAFARIS is designed to provide robust spatial modeling and mapping capabilities, allowing users to run phenology models and analytic tools that can be customized for each plant pest using various climate data sources. “We developed SAFARIS to allow PPQ users to rapidly develop models that could aid pest risk analyses,” said Risk Analyst/Entomologist Dr. Amber Tripodi. “By providing pre-processed climate data, customizable tools, and a variety of complex models contained within one, seamless environment, SAFARIS greatly reduces the time an analyst would normally have to spend processing data and creating models.”
The models and tools within SAFARIS allow PPQ to develop various types of maps, such as climate suitability maps and insect phenology (i.e., when pests emerge after winter) timing maps for plant pests, to inform decision making for pest surveillance programs.
SAFARIS integrates pest biology information, climate and non-climate data drivers, and predictive models to provide users with readily accessible and easily customizable tools to analyze pest and disease risks. The phenology prediction models, spread forecasting models, and other climate-based analytical tools in SAFARIS help users understand which areas are suitable for establishment and when surveys would be most fruitful. The models also aid in other analyses that inform decision-making, operational efforts, and rapid response.
The paper introduces the components of SAFARIS and provides two use cases demonstrating how pest-specific models support PPQ’s mission: climate suitability mapping to support pest surveillance and PestCAST phenology predictions to support domestic programs.
Phenology Models
A phenology model predicts the timing of an organism’s developmental stages based on its exposure to adequate temperatures over time. Phenology models are often called "degree day" models because heat exposure for the organism of interest is measured in a unit called degree days.
To provide early warning guidance for spongy moth operational decisions, the SAFARIS PestCAST model uses near-real time, 7-day forecast, and historical weather data to produce 7- and 30-day forecasts for the beginning of adult emergence and for the period after adult emergence has ended and adults are no longer active (post–adult emergence). It is an interactive mapping system that allows users to select a specific location and obtain detailed information on the pest’s current and expected development at that location and compare the current conditions with conditions from previous years.
PestCAST predictions are used to schedule surveys and treatment applications and to help raise public awareness on when to expect to see pests in the field. In addition, PestCAST generates national maps daily in an easy-to-share PDF format that can be downloaded from the SAFARIS website.
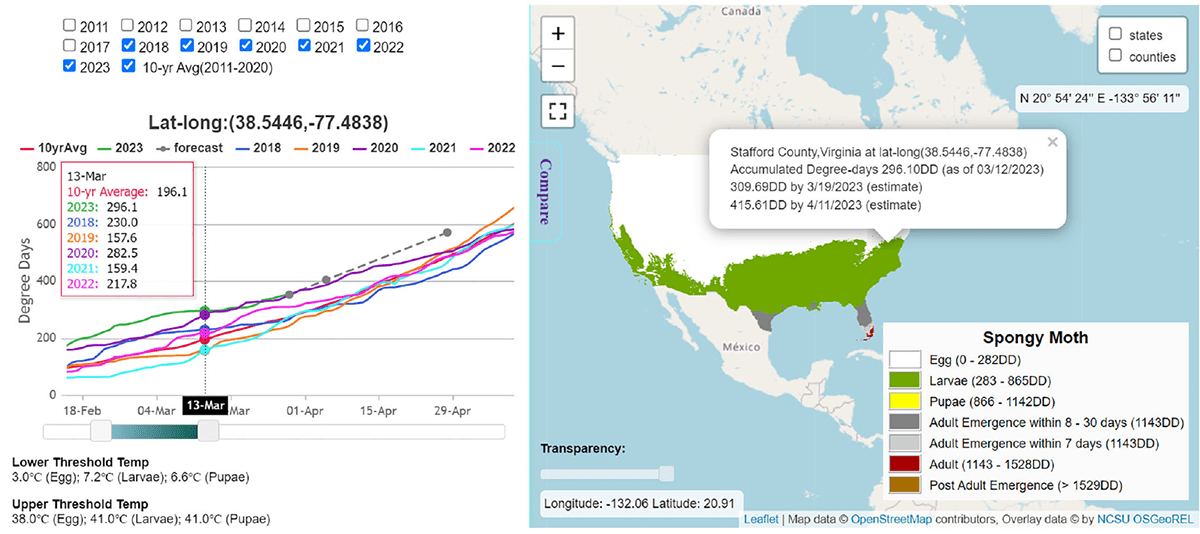
Figure 1: Spongy moth PestCAST: PestCAST predicts the current and the next 7- and 30-day spongy moth stages using the Phenology Model with near real-time weather information, 7-day weather forecasts, and historical weather data. The interactive mapping system allows users to obtain detailed information on specific locations and compare the current conditions with previous years.
Suitability Models
The Cooperative Agricultural Pest Survey (CAPS) program conducts exotic plant pest surveys through a national network of cooperators and stakeholders to protect American agriculture and natural resources. Because CAPS pests are non-native to the United States, the SAFARIS climate suitability maps help support survey planning and prioritization by showing where pests could establish. Each model is customized with pest-specific information that reflects known temperature tolerances, moisture requirements, or other physiological requirements for growth and survival. For example, oak ambrosia beetle cannot survive temperatures below -20.3°C, but because it lives inside trees, it is somewhat protected from ambient temperatures. The model used to generate the climate suitability map for this pest incorporates an insulation factor to reflect the protection from cold provided by the beetle’s habitat (Figure 2).
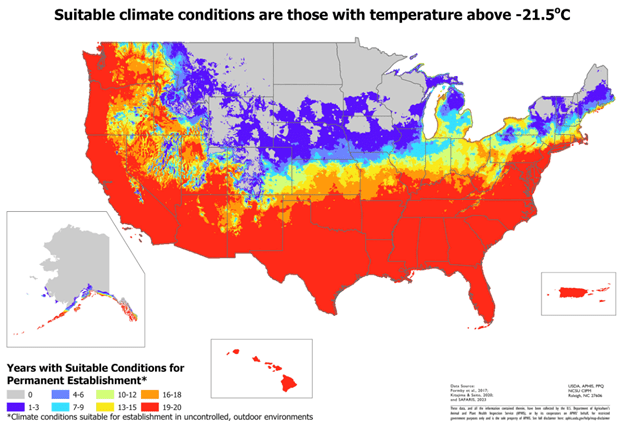
Figure 2: Number of years with suitable conditions for oak ambrosia beetle in the contiguous United States, Hawaii, Puerto Rico, and Alaska. Suitable condition requirements where the daily ambient temperatures were above (-21.5°C), the lower lethal temperature threshold (-20.3°C) with a tree-interior insulation factor of 1.2°C.
For each of the climate suitability maps, SAFARIS uses the 20 most recent years of weather data to reflect year-to-year weather variation and show the range of suitability across the United States.
Climate Change Models
Climate is changing. Therefore, it is important to use the most recent years of weather data rather than average historical data to predict what is likely to happen within the next few years. Climate change can increase the frequency and intensity of extreme weather events. These extreme weather conditions are expected to significantly influence some agricultural pests.
“We are currently developing new analytic approaches using long-term projections to understand the potential changes in pest establishment and impacts under climate change,” said Takeuchi. “It is challenging to model long-term effects on plant pests. Extreme weather events affect each plant pest species differently. Some pests may not have any noticeable impacts, while others might have significant impacts. Projections of future climate conditions are inherently uncertain.”
SAFARIS continues to concentrate on improvements that expand its capacities and communicate uncertainty. Since PPQ must quickly respond to any outbreaks of invasive pests and other little-known species, SAFARIS’ goal is to develop a framework that will integrate several model types with climate data to effectively address a variety of pest-risk questions in a timely manner.
Visit the SAFARIS web page to view all SAFARIS models, tools, and data. For more information, email Yu.Takeuchi@ usda.gov or Amber Tripodi at amber.tripodi@usda.gov.
Additional References
SAFARIS: A Spatial Analytic Framework for Pest Forecast Systems
SAFARIS
#