
Swine: African and Classical Swine Fever State Animal Health Official Reporting Dashboard Quick Guide
USDA’s Animal and Plant Health Inspection Service (APHIS) surveys for African swine fever (ASF) and classical swine fever (CSF). The ASF/CSF dashboard provides State animal health officials with both national- and State-level views of APHIS’ surveillance data. APHIS uses this data to strengthen disease detection capabilities, enhance outbreak preparedness, and support claims of disease freedom in this country.
Overview
Users navigate the dashboard by clicking on the tabs at the top of the main page. The dashboard includes six tabs: a summary tab, four tabs that present detailed information by surveillance component, and a definitions tab for reference.
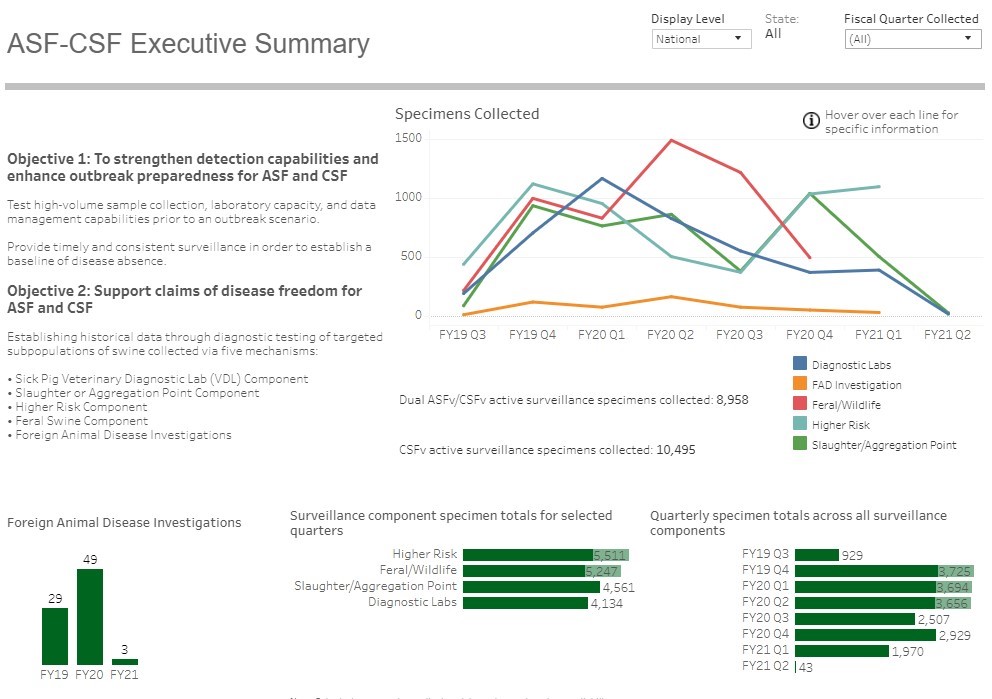
The summary page provides a quick overview of all ASF/CSF surveillance data. At the bottom of the summary page are three bar charts. The first shows the number of foreign animal disease investigations by fiscal year. The second provides the total specimens collected for each surveillance component in the selected quarter(s). The third displays the total amount of specimens collected for active surveillance components across fiscal quarters.
The other tabs provide more detailed information about the specific surveillance components, which are:
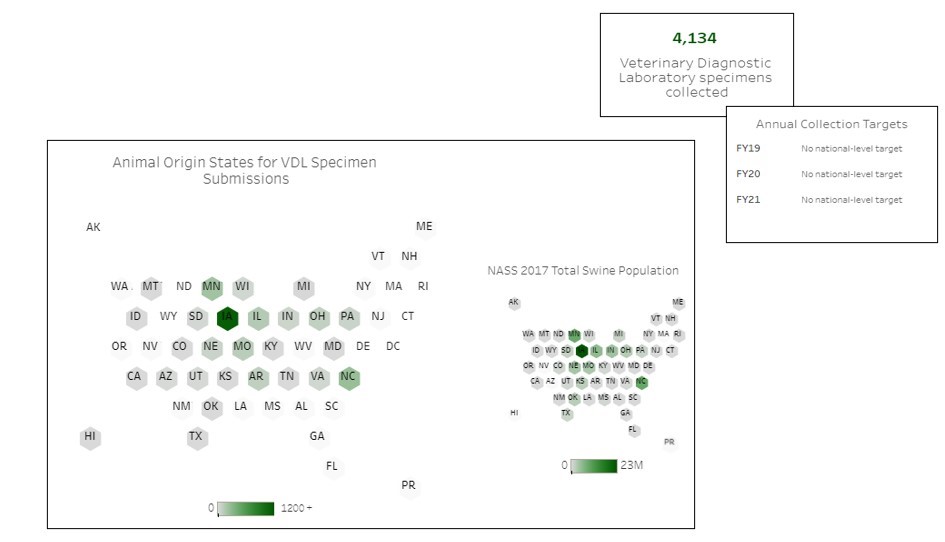
- Sick pig samples submitted to a veterinary diagnostic laboratory
- Swine at slaughter plants
- Swine with a high risk of exposure
- Feral swine
Each tab includes total counts of specimens collected in the selected fiscal quarters, annual collection targets (if applicable), and a geographic representation of the specimens collected. Users can filter information by fiscal quarter and year as well as by display level (national or State). Users can also hover over the graphics on the dashboard for additional information.
Quick Tip: Users can find a description of each swine population on the "Definitions" tab under "Definitions and Population Descriptions."
Frequently Asked Question
What is NASS? In the dashboard, users will see references to NASS. NASS stands for USDA’s National Agricultural Statistics Service. The dashboard uses data collected from the national agricultural census to estimate livestock populations geographically.
Need Help?
If you have trouble accessing the dashboard or viewing the data it contains, contact vs.data.services@usda.gov.
Please direct questions about dashboard content to the animal health point of contact listed in the dashboard.